Chapter 4 Design Weights
In a dataset, survey weights are captured by a variable that indicates how much each respondent should “count.” For example, a respondent who has a 1 for a weight variable would count as a single respondent; a respondent who receives a .5 for a weight variable should count as half a respondent; and a respondent who has a 2 would count as two respondents.
Stata has four different options for weighting statistical analyses. You can read more about these options by typing help weight into the command line in Stata. However, only two of these weights are relevant for survey data – pweight and aweight. Using aweight and pweight will result in the same point estimates. However, the pweight option is the more correct option because aweight does not calculate the standard errors correctly. However, in some cases you may be forced to use aweights as most, but not all, Stata commands support the pweight option (e.g. graphing options).
The 2010 UMass Poll Massachusetts Exit Poll includes a variable called weight. Respondents in the exit poll were weighted to account for the stratified nature of the sampling procedure. By stratifying towns by geography and other factors, not every voter had an equal chance of being sampled. Thus, the weight variable adjusts for this fact.
The easiest way to implement sampling weights when conducting statistical analysis is a two-step process. First, just one time at the beginning of your session you need to tell Stata that your dataset includes a weight variable by typing the following command:
svyset [pw=weight]svyset is the command, then the rest of the command is in brackets. pw is the type of weight being used (it should always be pw for survey data) and weight is the name of the variable that includes the information needed to weight the data.
Once you have done this, Stata now knows which variable to use to weight the data (and how to apply those weights). However, you still have to ask Stata to weight the data whenever you run an analysis. For example, let’s say we wanted to look at the vote for Governor. If we just tabulated the variable, we would get the following:
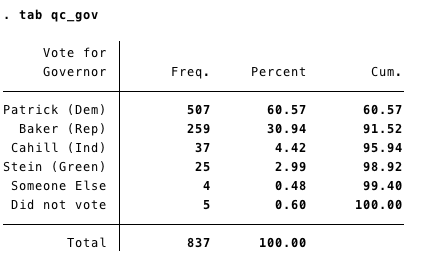
However, the above tabulation does not weight the data to adjust for the sampling approach. To do this, you need to use svy: as a prefix to whatever command you are trying to use. So, now you can do the same tabulation but apply the weights to it:
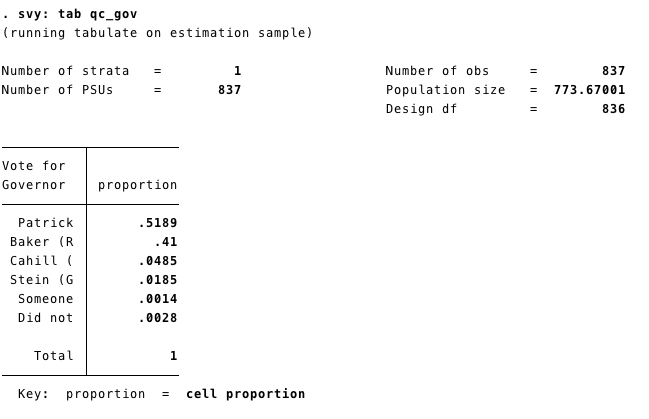
Notice that applying the weights had a pretty big effect on the results. With the sampling weight accounted for, Patrick receives 52% of the vote, much closer to what he actually received in the election.